Your project reports on autopilot

AgileCharts is an automated stakeholder reporting tool created to help save time, ensure clear communication and easy to follow project reporting.

Features

Save time creating weekly reports

  • Create one-time and recurring reports with ease
  • Reports copy from the previous week allowing easy updates
  • Data from your favourite project management tool automatically included

Let status reports come to you

  • Team members update their assigned report sections directly
  • Automated reminders if updates are not completed by your deadline
  • You can see reports in real-time as they’re created by the team

Ensure clear communication

  • Distribute reports automatically to stakeholders once complete
  • Keep your stakeholders in the loop, see exactly who has read your reports
  • Get real-time comments and feedback on distributed status reports

Track project progress

  • Review updates over report periods to see exactly where projects are getting stuck
  • Easily see what has and hasn’t been done week-to-week or month-to-month

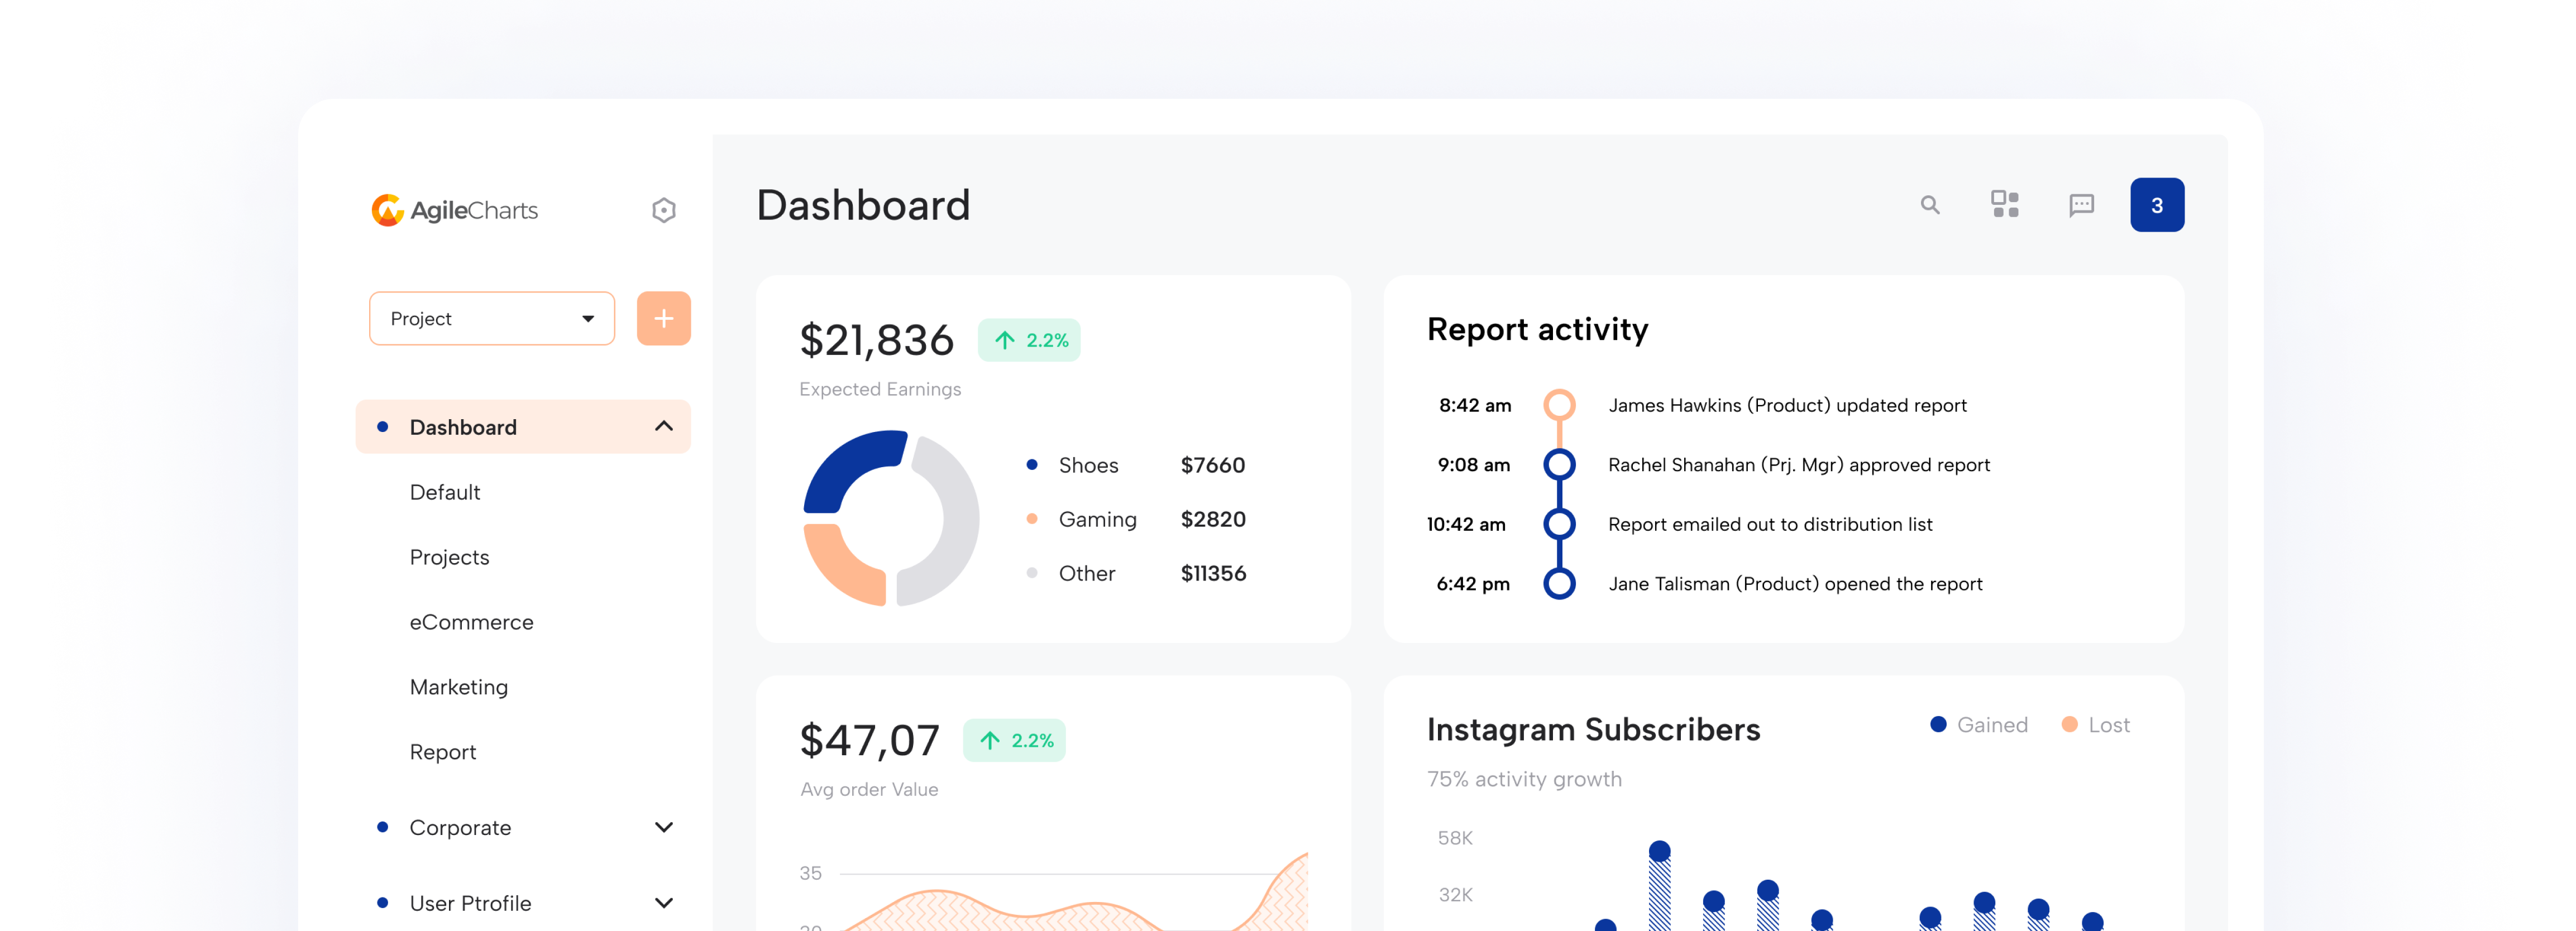
Dashboard & Custom Charts

Project metric in one place

Get all of your project dashboards pulling data from all the different project management tools your team's use in one place
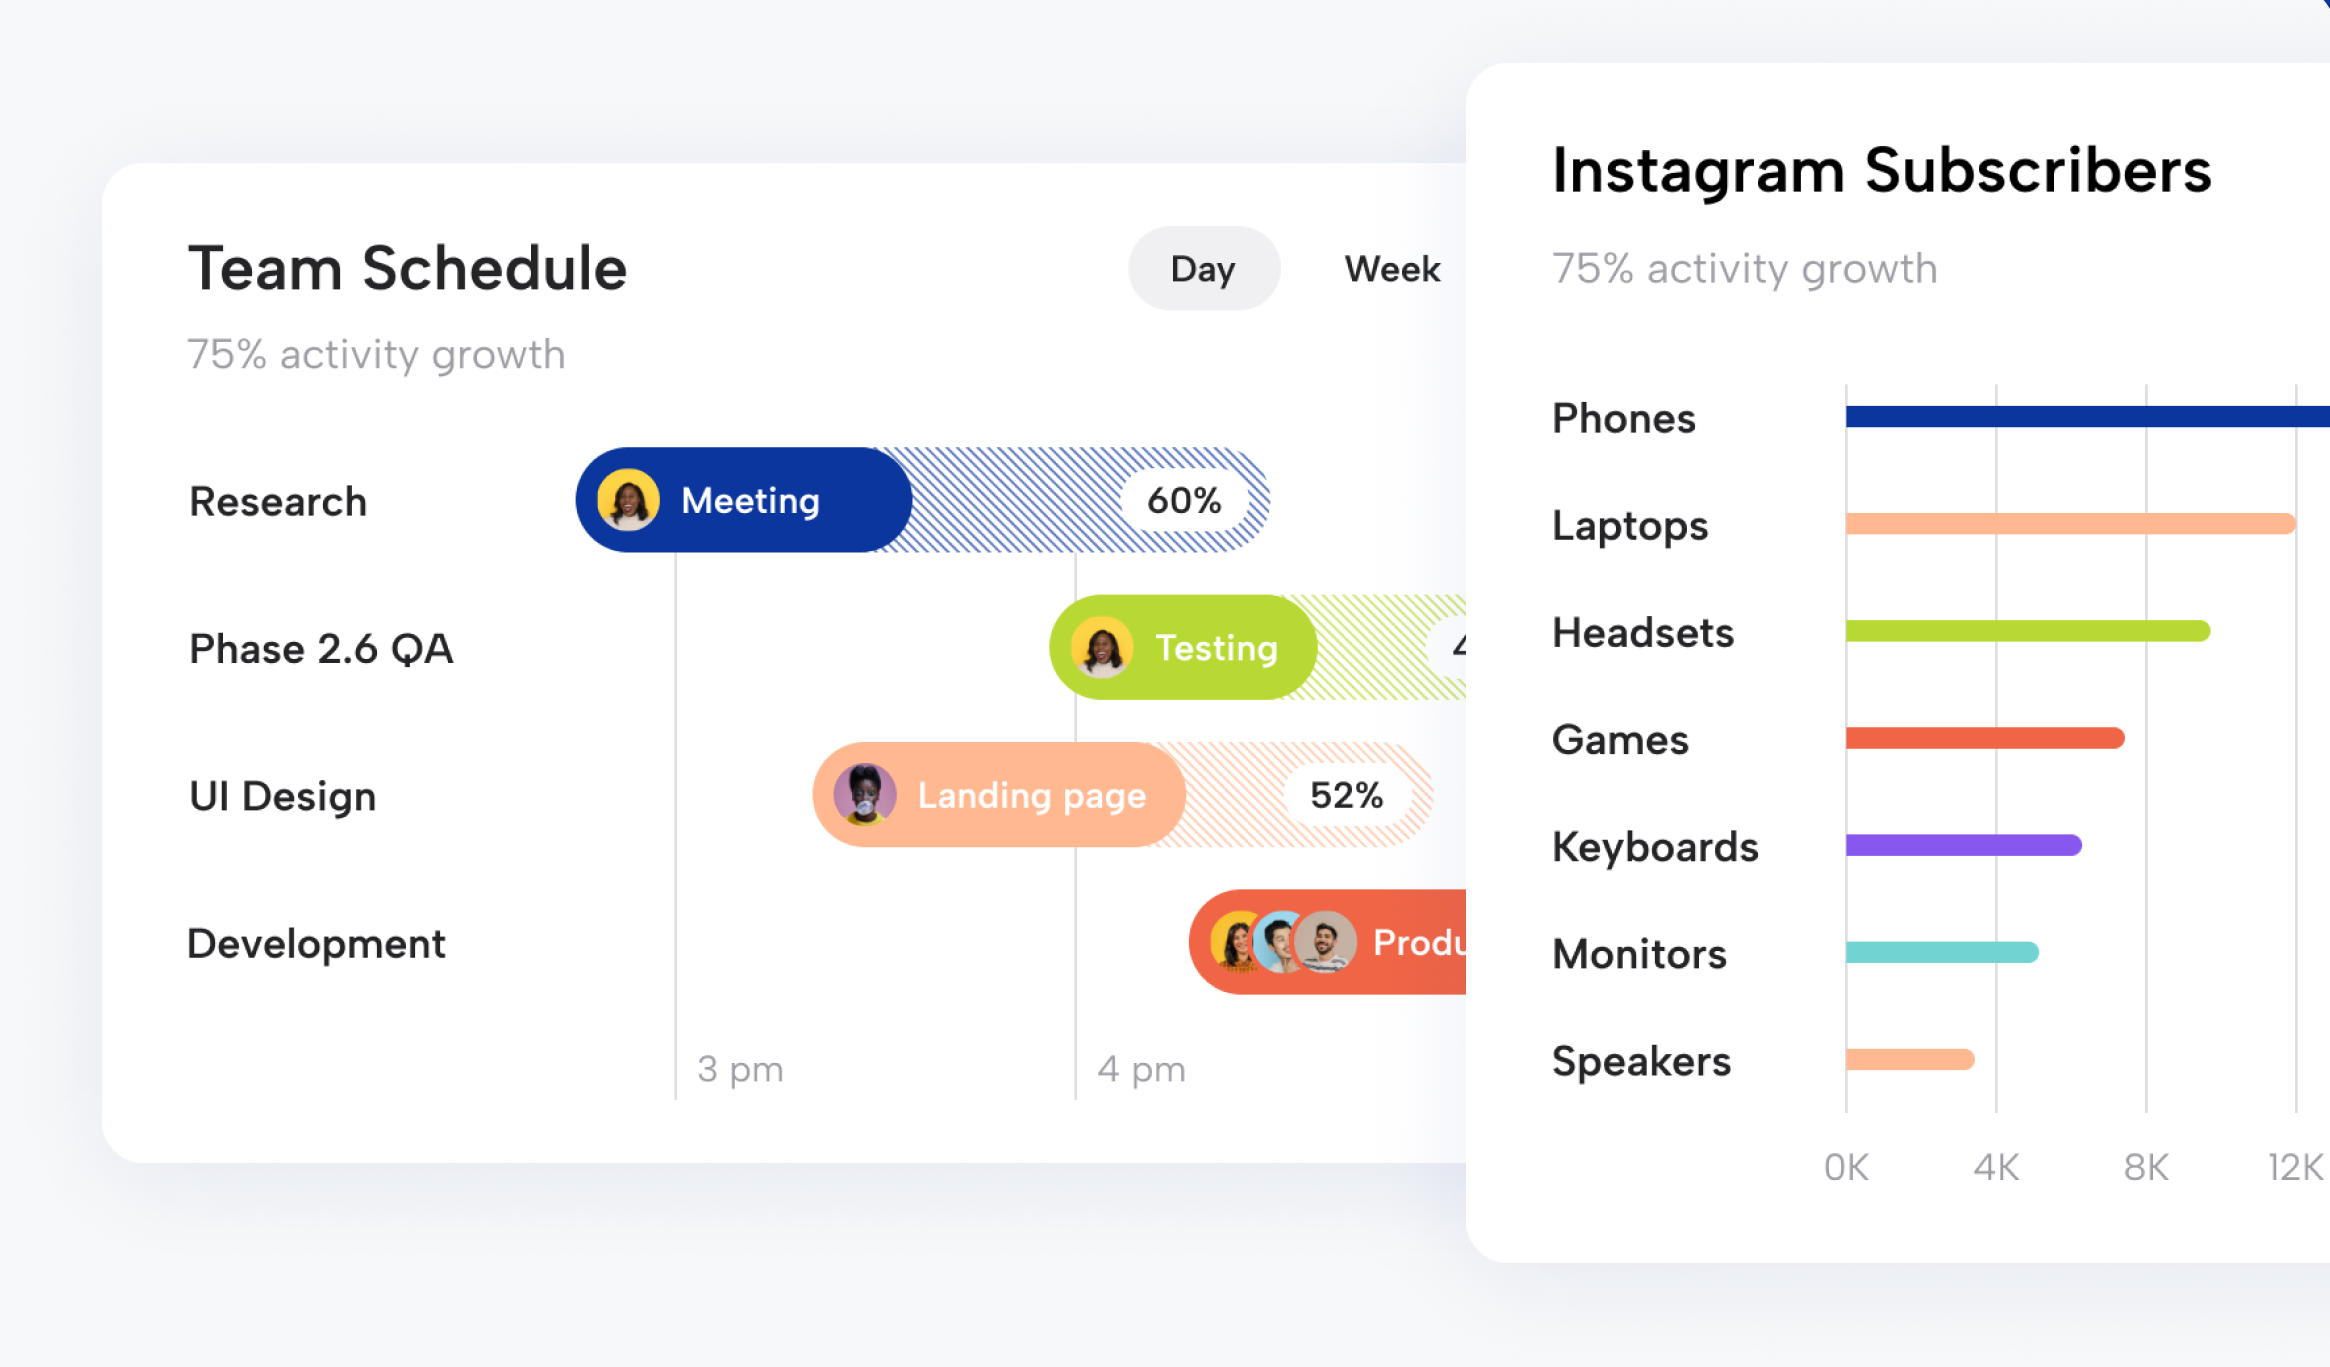
Pre-defined charts

Use our out of the box pre-defined charts to show key data

Default presets for each different project management tool
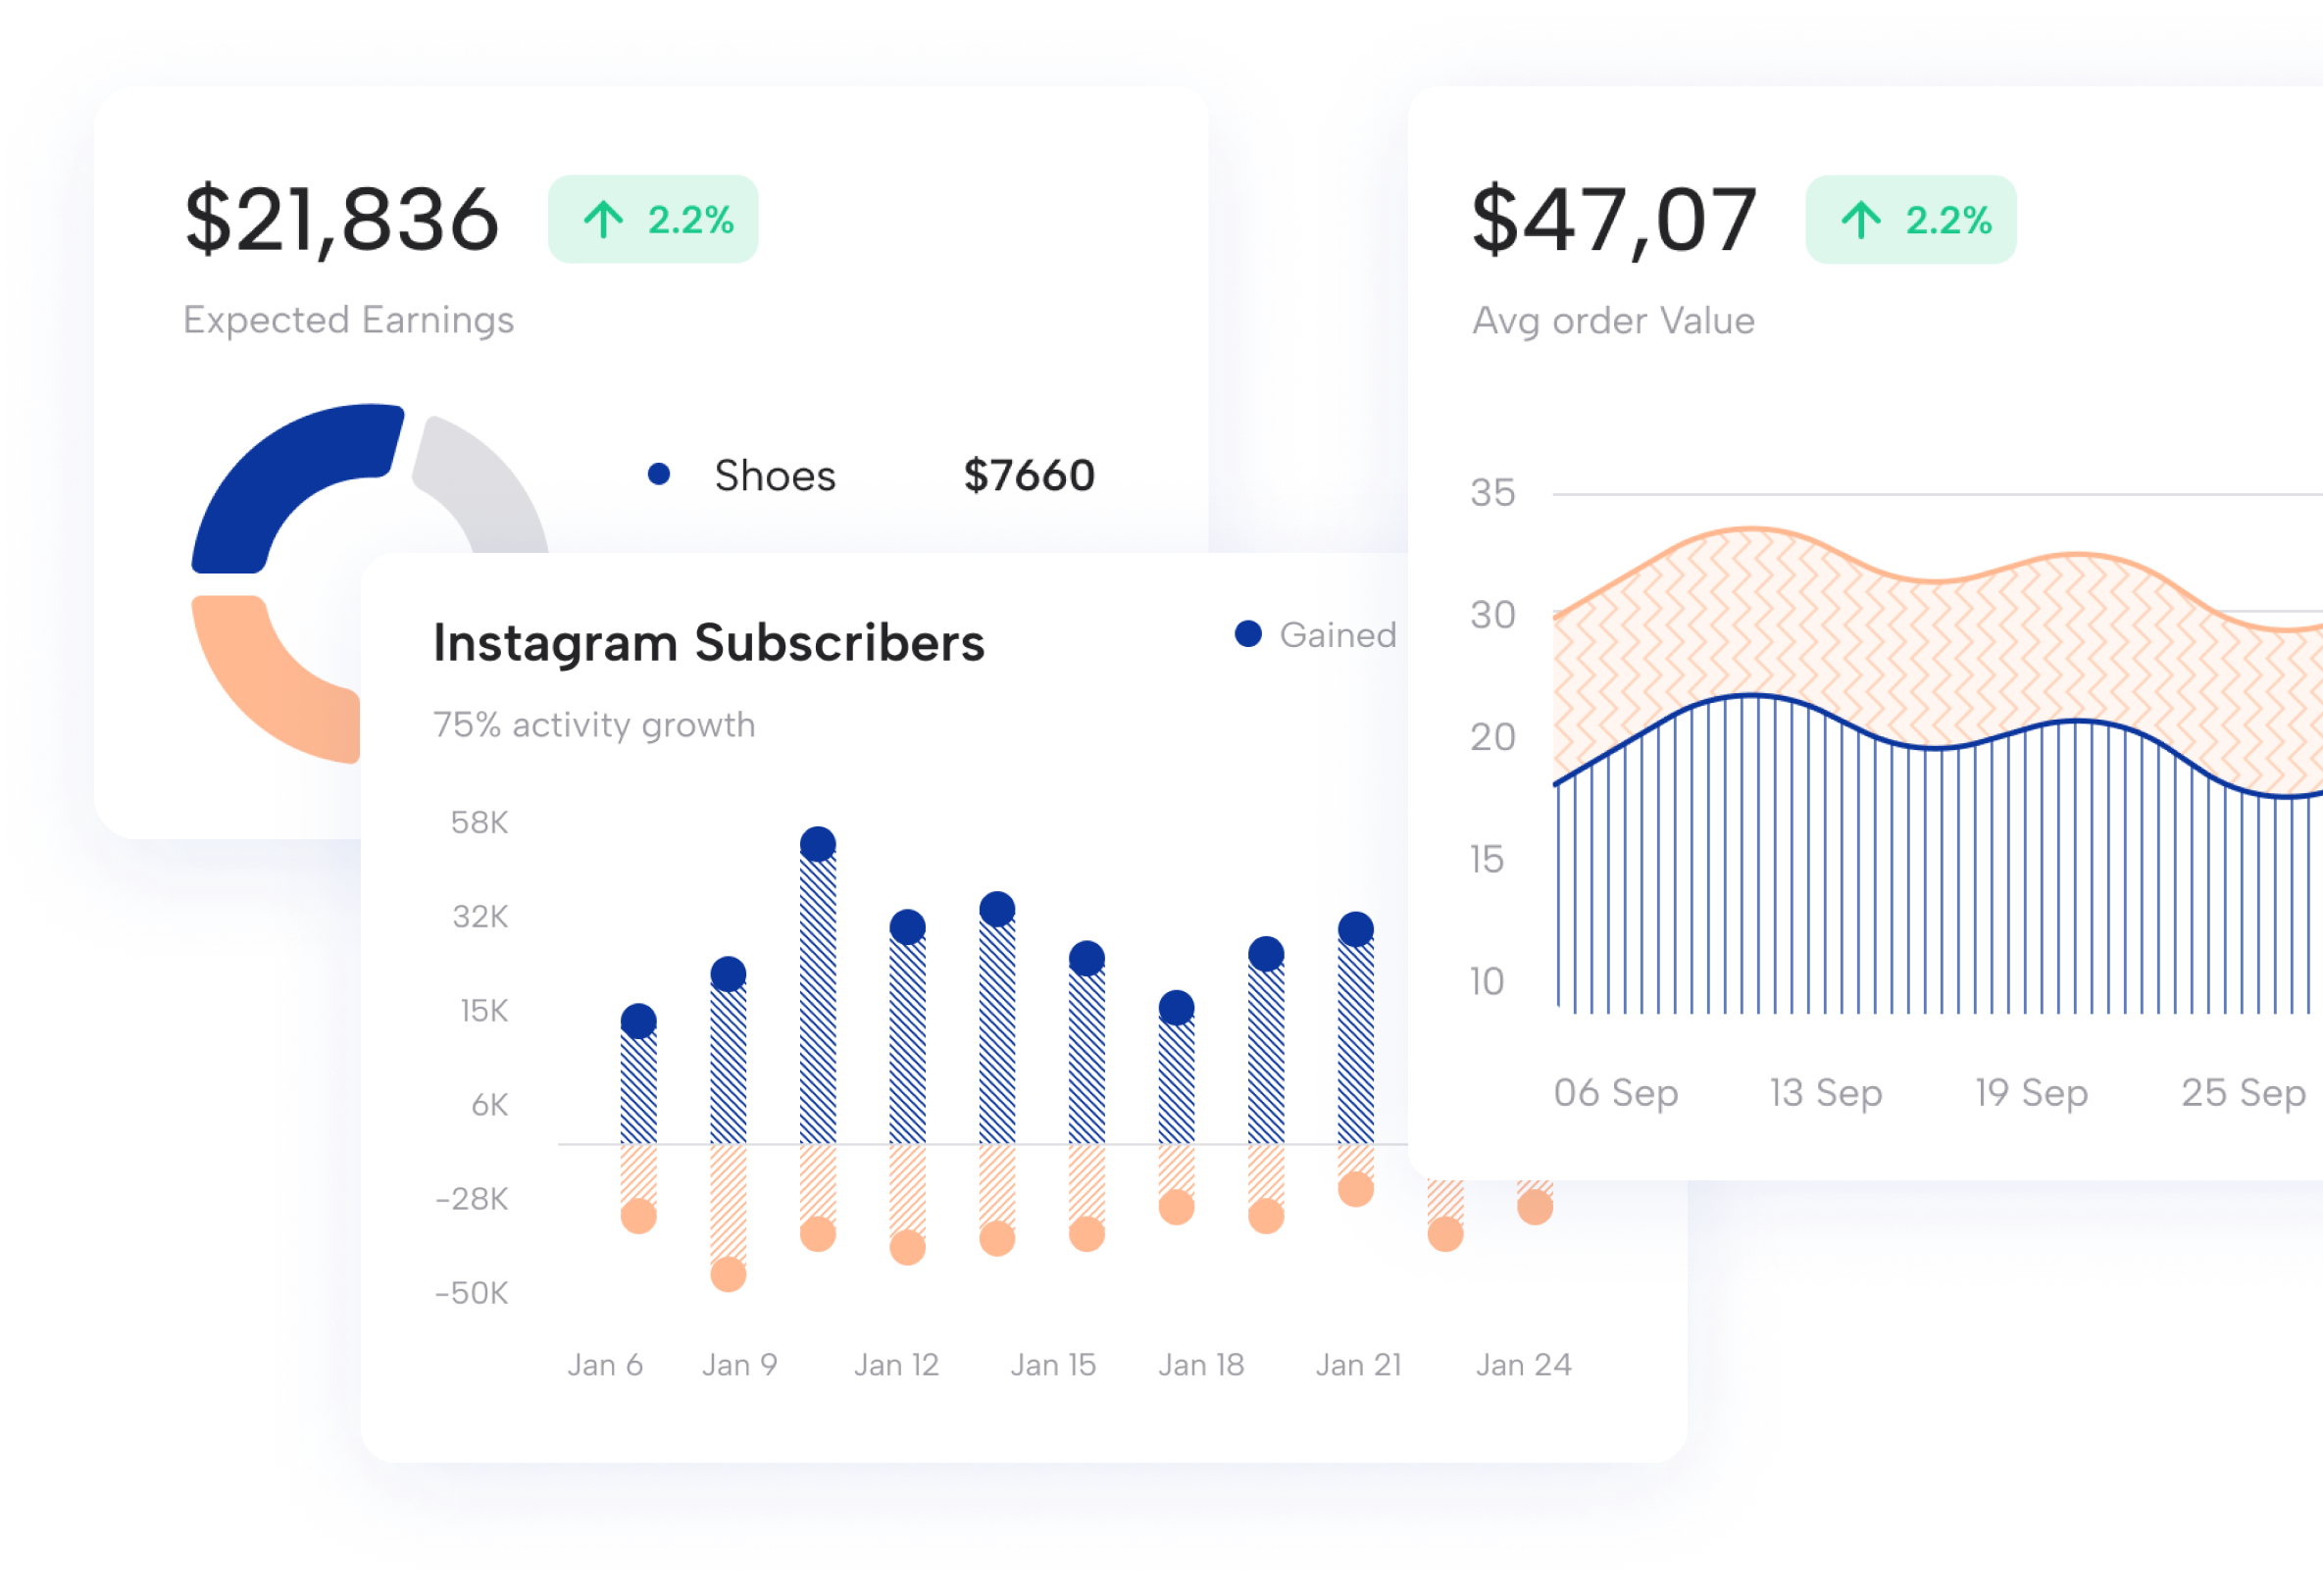
Custom charts

Chart any metric in your project

  • Chart any data point available in your project into a pie, line, bar or stacked bar chart
  • Group data in any way you like to see breakdowns by team member or tasks type

Say hello to accountability and well documented project reporting